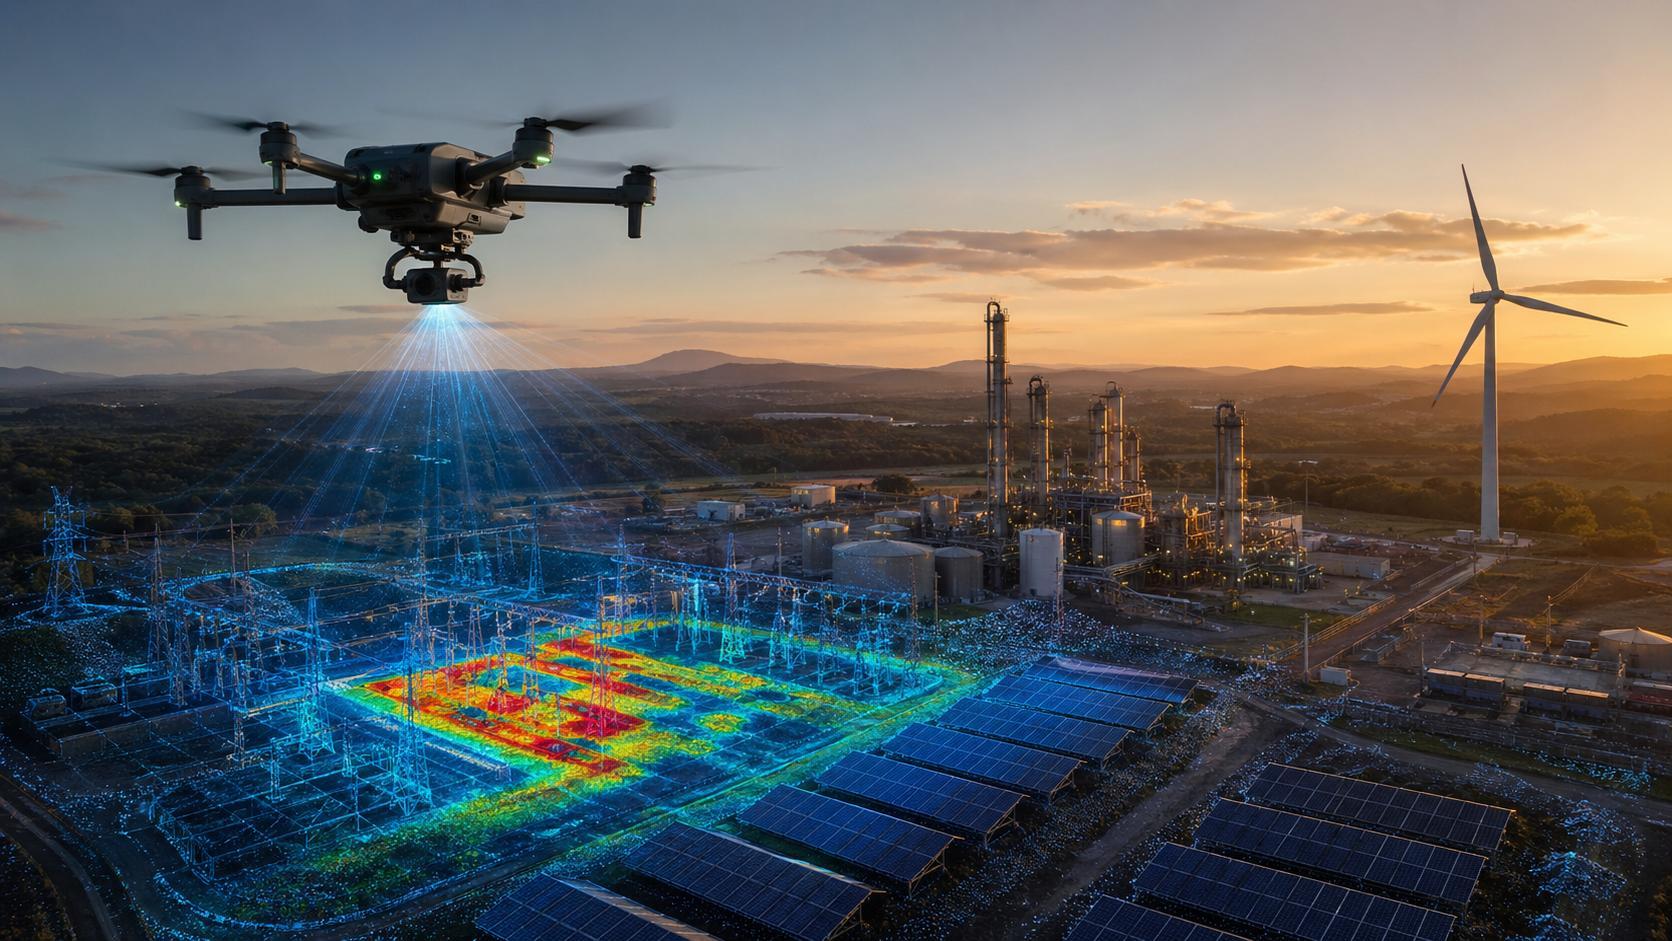
Drone scanning means a documented aerial inspection, not a video flight. We combine a radiometric thermal camera, LiDAR, photogrammetry and RTK positioning in a single workflow: every anomaly found comes with a position, an image, an apparent temperature, a severity rating and a recommended action.
The practical advantage is reach — quickly and safely, where scaffolding, a cherry picker or a shutdown would otherwise be needed.
What we do with it
- Infrared anomaly detection — hot spots, energy losses, overheating, water ingress, damp areas and leaks.
- 3D measurement — LiDAR point cloud, digital models, volumetrics, profiles and geospatial inventory.
- Periodic monitoring — the same site compared over time, for preventive maintenance and failure prediction.
- Technical reporting — PDF, maps, anomaly tables, CAD/GIS files and georeferenced imagery.
Technology and sensors
The flight configuration and the sensors are chosen according to the objective, the access, the accuracy required and the measuring conditions.
- Radiometric thermal camera — thermograms, apparent temperature maps, anomalies and severity.
- Airborne LiDAR — point cloud, digital terrain and surface models, sections, volumetrics.
- 4K RGB — detailed visual inspection, orthophoto, photo and video documentation.
- RTK / GNSS / GCP — georeferencing, positioning and deliverables integrated into GIS/CAD.
- UAV platform with planned flight, repeatable paths and acquisition from a safe distance.
Photovoltaic panels
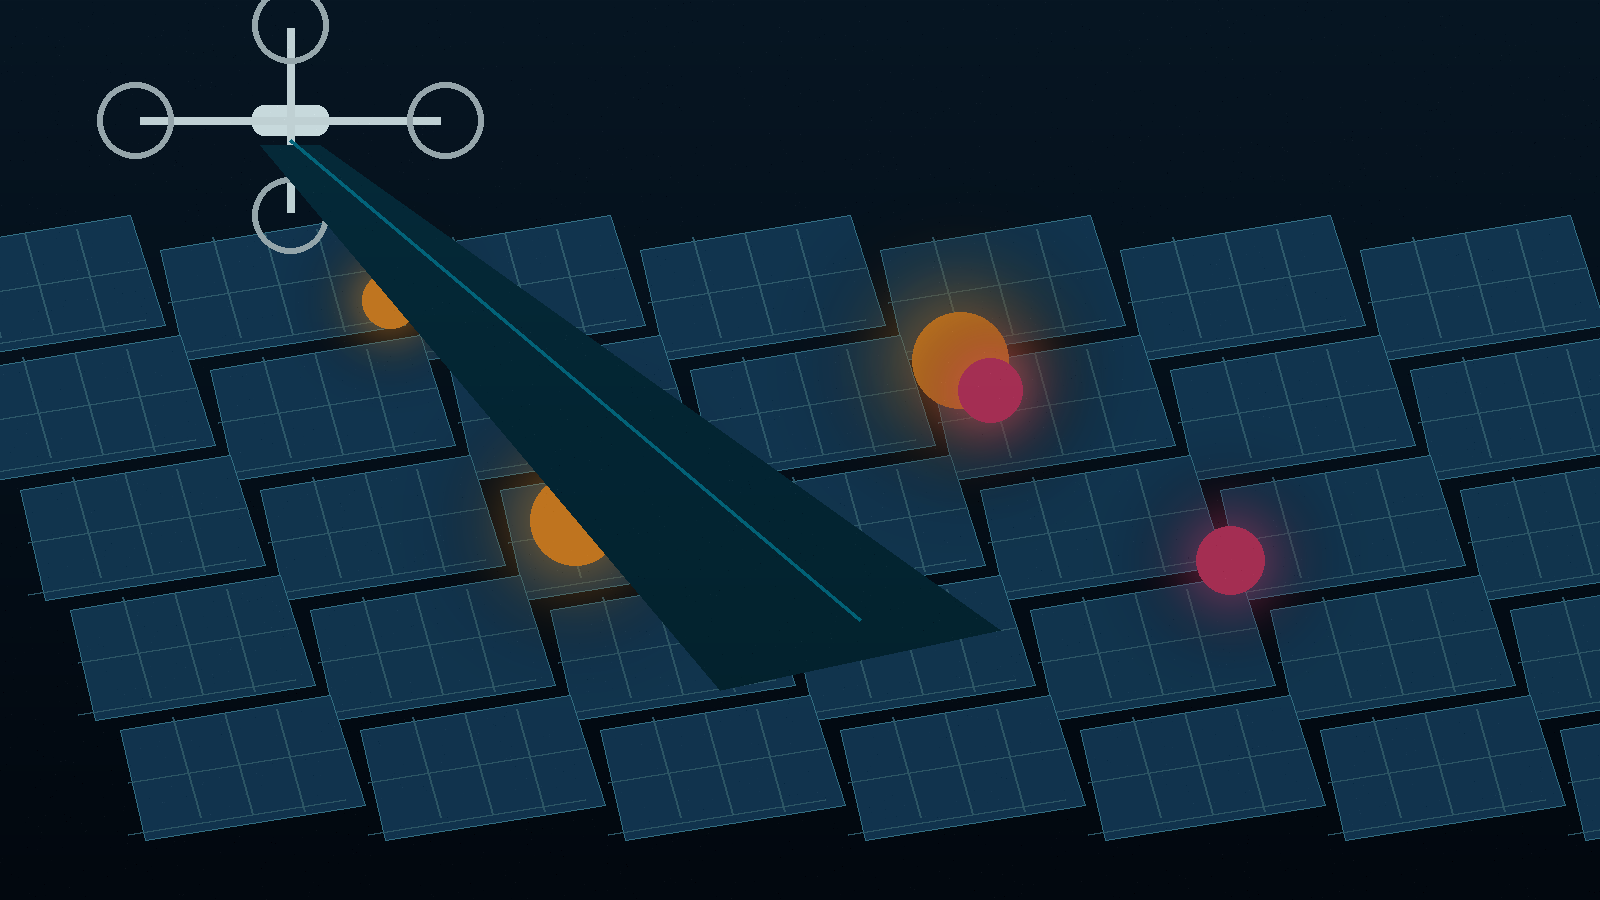
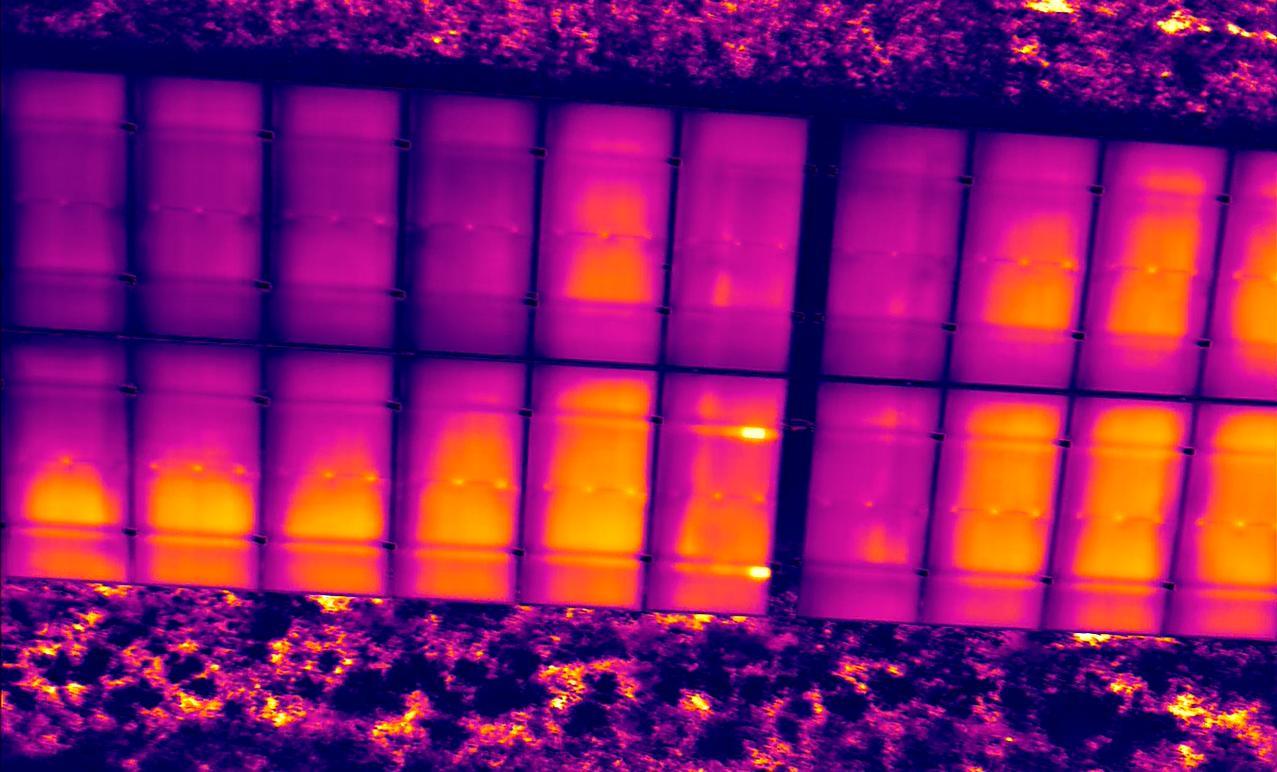
- Hot spots identified at cell, module or string level.
- Failed bypass diodes, loose connections and underperforming modules detected.
- Contactless scanning with no dismantling and minimal impact on output.
- A report with location, RGB and IR imagery, severity and intervention priority.
- Before/after comparison for cleaning, repair or module replacement.
Typical deliverables: RGB orthophoto, thermal map, anomaly table and maintenance recommendations.
Wind turbines
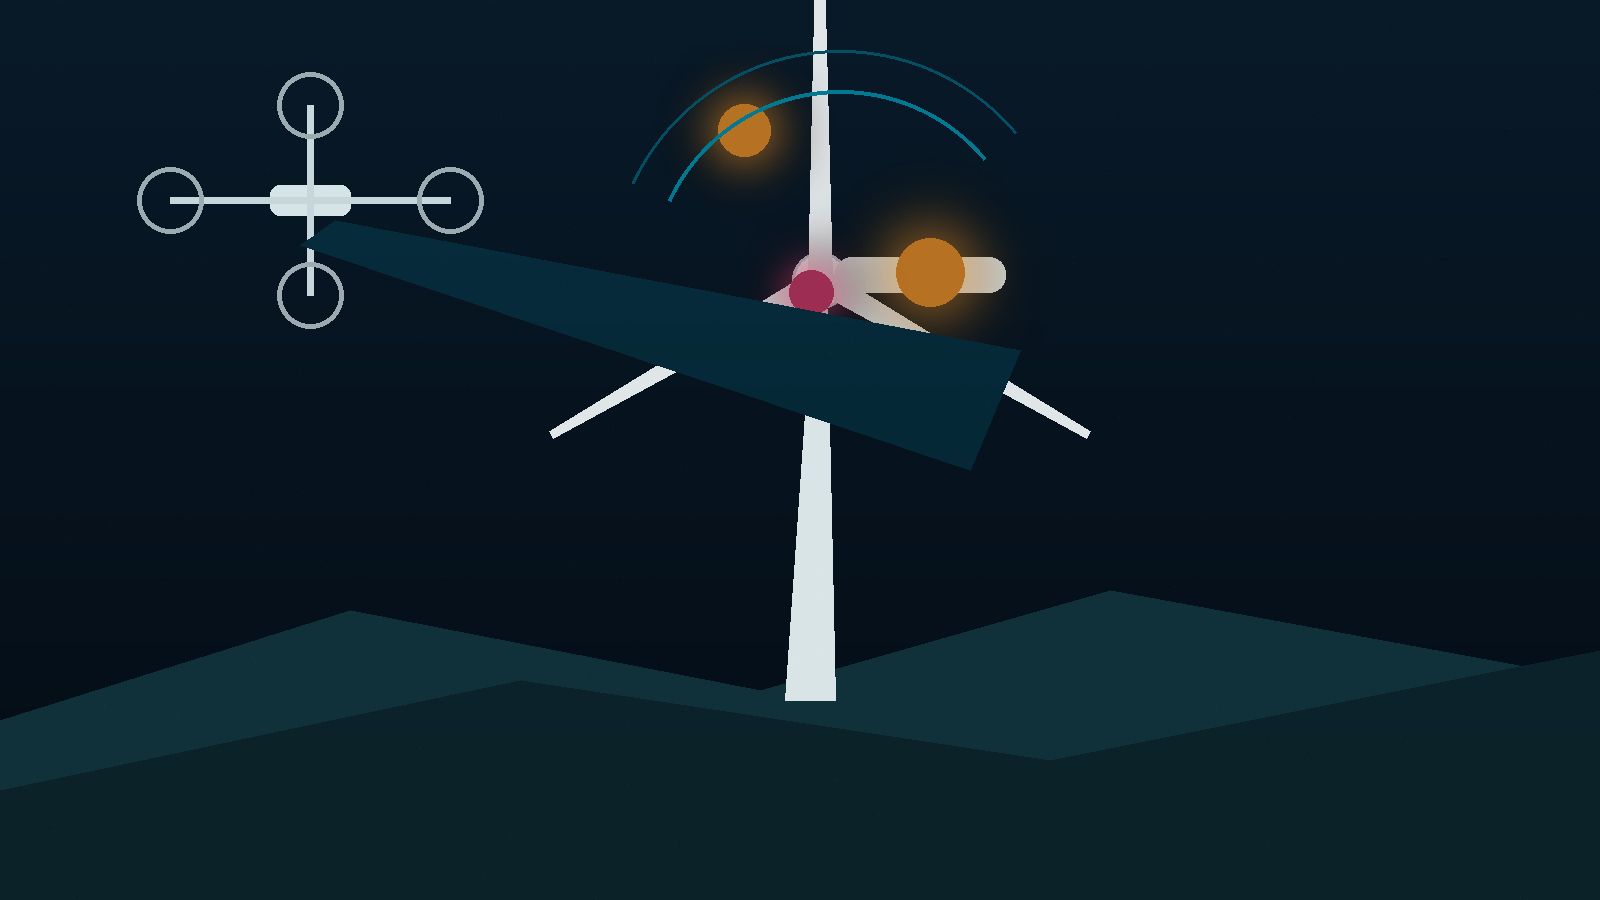
- Visual analysis of the blade, nacelle, tower and mounting areas.
- Thermal indications of overheating in exposed mechanical and electrical components.
- Less work at height and less downtime.
- Photo and video documentation for the record and for periodic comparison.
- Interventions prioritised by risk and severity.
Weather conditions, flight safety and stand-off distances are agreed before the intervention.
Thermal, HVAC-R and industrial systems
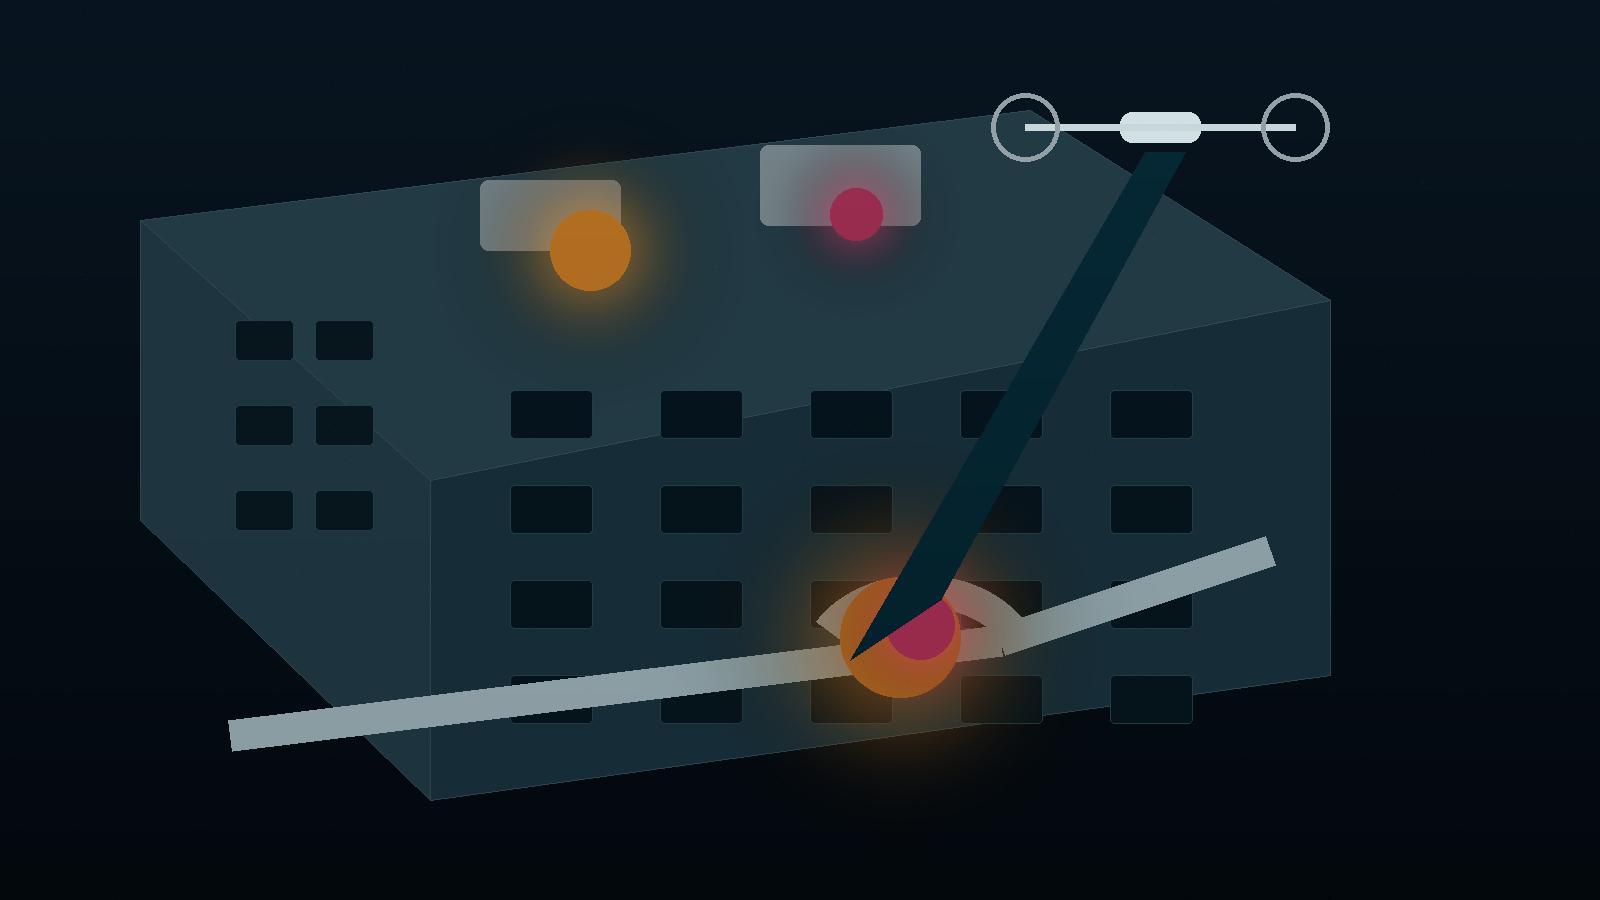
- Pipework, boiler plants, chillers, heat pumps, heat exchangers and plant rooms.
- Heat or cooling losses, thermal bridges, condensation areas and compromised insulation.
- Checks on industrial roofs, halls, façades, external runs and visually accessible equipment.
- Support for maintenance, energy audit and repair decisions.
- RGB photographs and thermograms correlated with the position on site.
Interpretation is always made in the context of ambient temperature, plant load and surface emissivity — a warm patch does not automatically mean a fault.
Heating networks and buried infrastructure
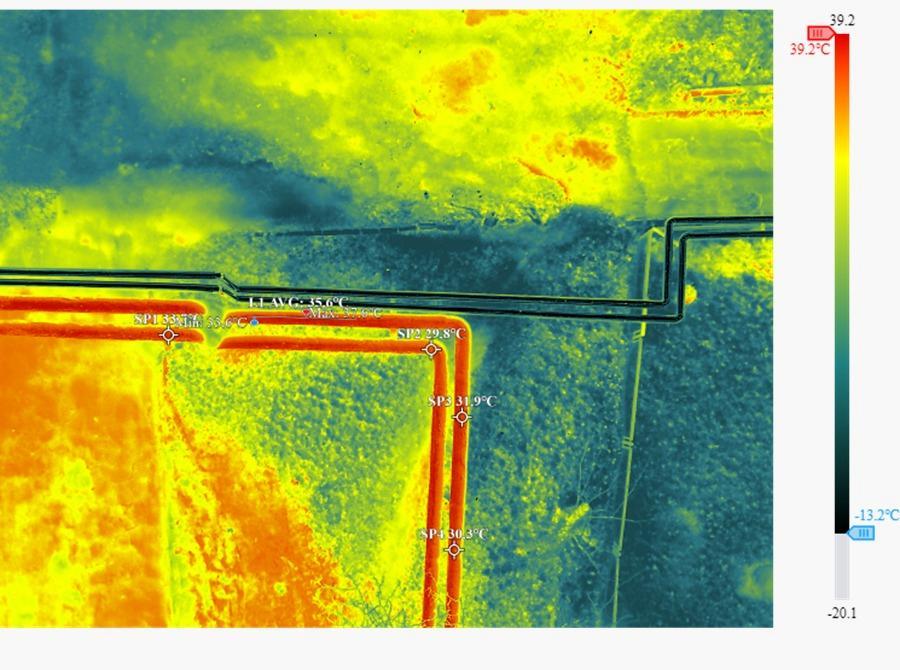
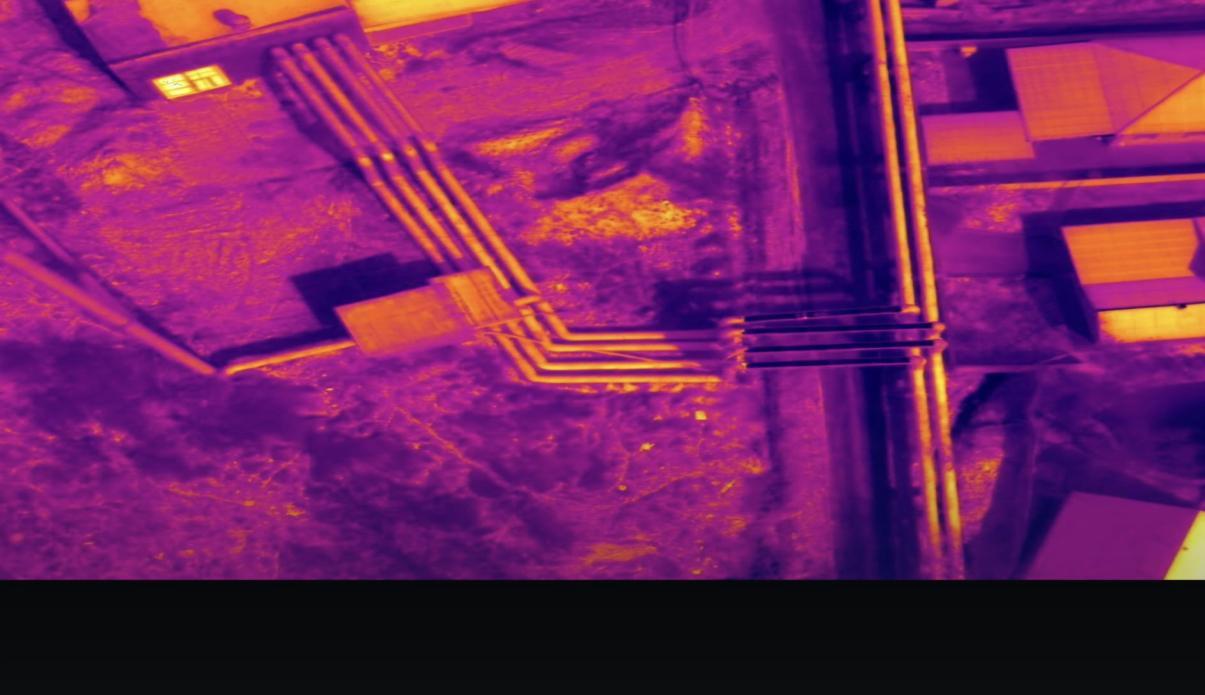
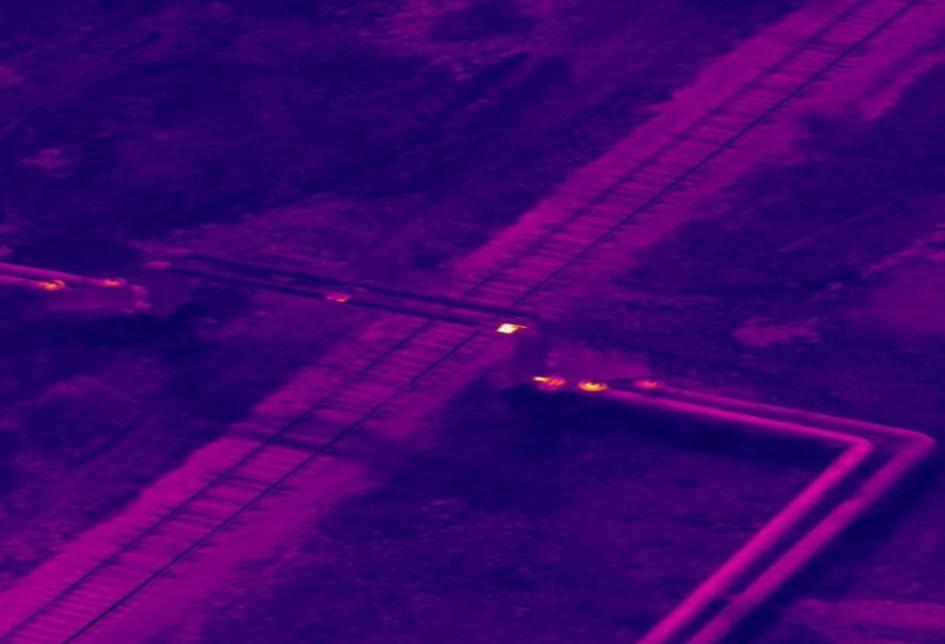
The clearest use case is a district heating network. A pipe losing heat warms the ground above it, and the thermal camera sees the warm trail at the surface. The method works for routes buried at roughly 10–50 cm, where the temperature difference still reaches the surface clearly enough to be measured.
For a district heating plant or an industrial site with its own network, this means losses are located on a map before any digging — you excavate where the fault is, not along the whole route.
Roofs, façades and buildings
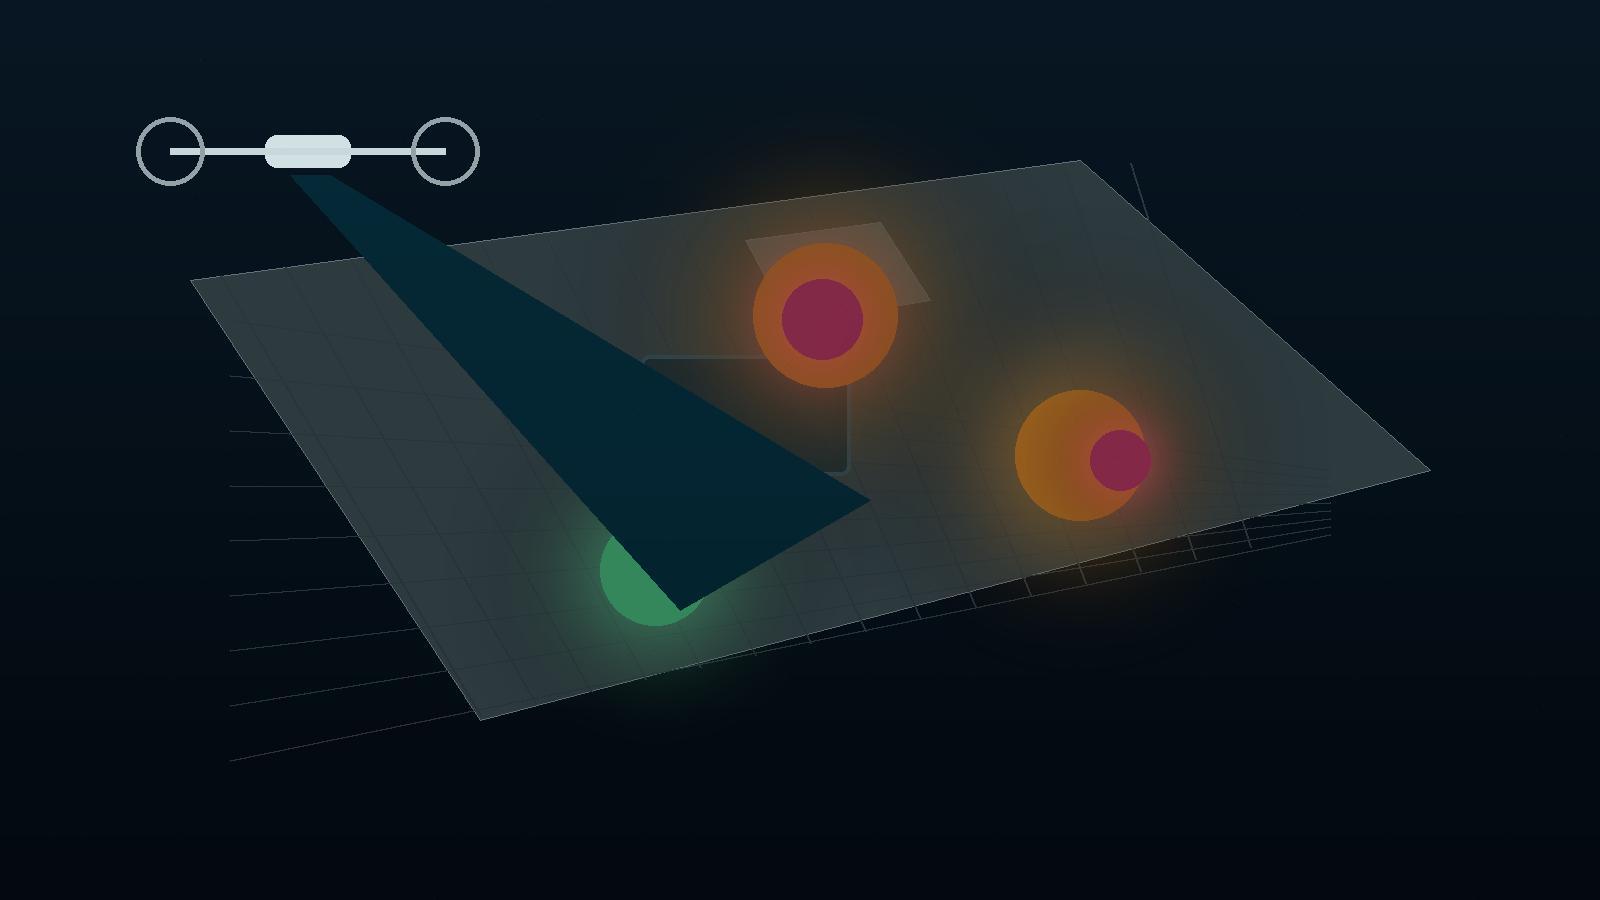
- Energy losses, thermal bridges, water ingress and suspected damp areas.
- Flat or pitched roofs checked without direct access onto the covering.
- Documentation for energy audits, handover inspections and preventive maintenance.
- Before/after comparison for repairs, insulation or sealing works.
- Integration with existing drawings, orthophotos and technical reports.
Sewerage, drainage and underground infrastructure
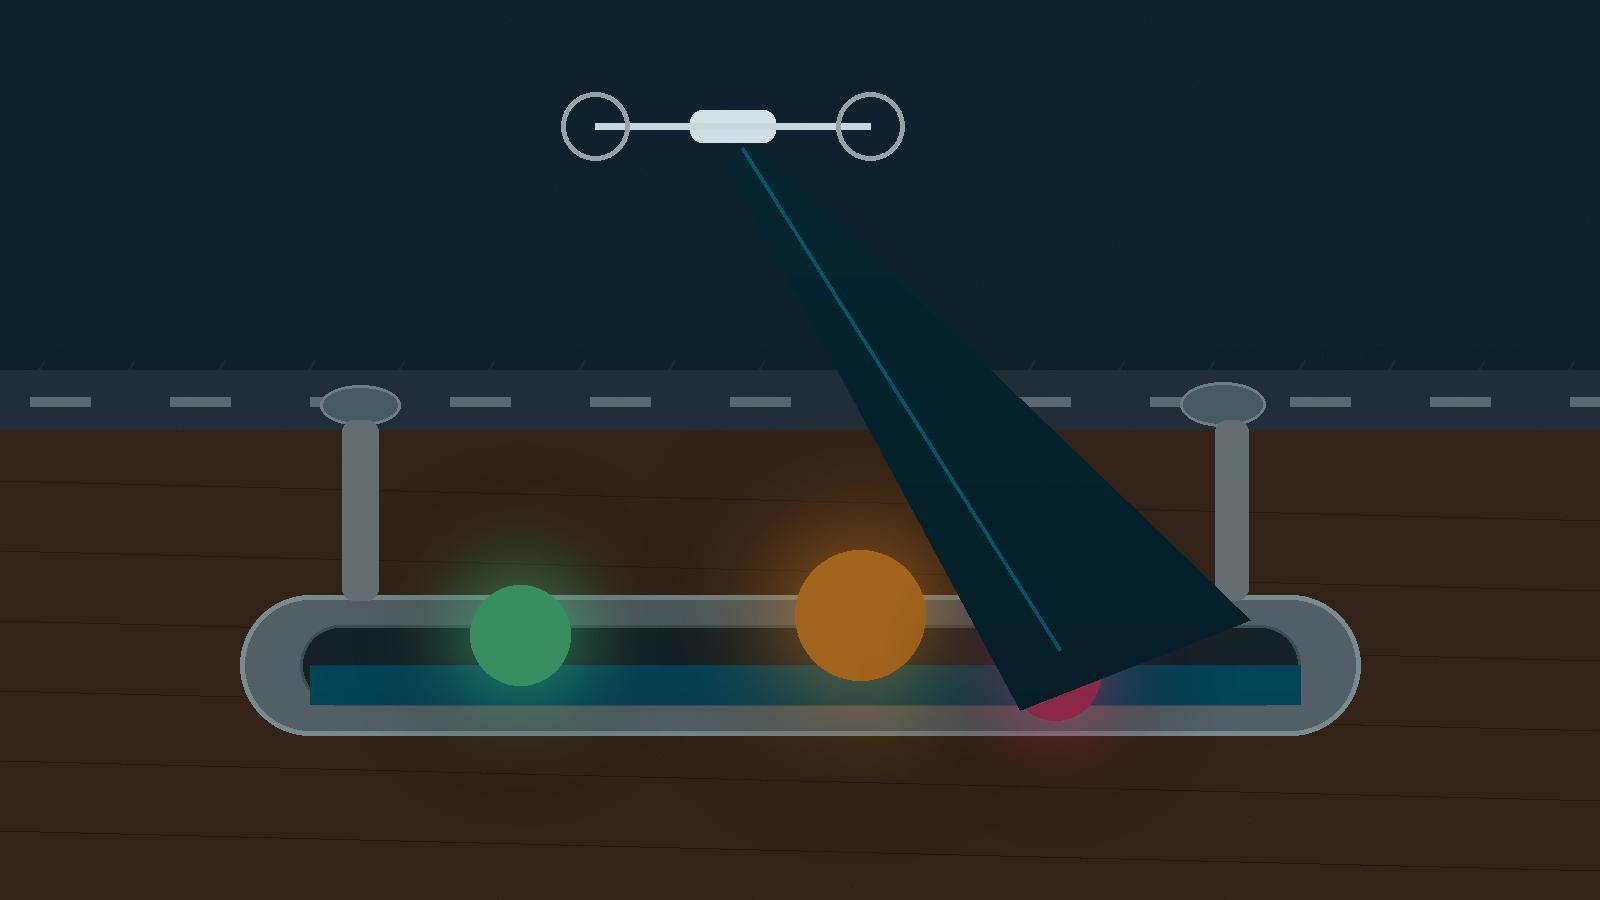
- Manholes, routes, gullies and standing-water areas located.
- Thermal indications of infiltration, exfiltration or damp areas at the surface.
- LiDAR for terrain models, thalwegs, flood-prone areas and drainage corridors.
- Integration with existing drawings and export to CAD/GIS.
- Prioritisation for CCTV surveys, tightness testing or targeted works.
Thermography points to anomalies and risk areas; confirmation comes from specialist checks on the ground.
LiDAR: point cloud and 3D modelling
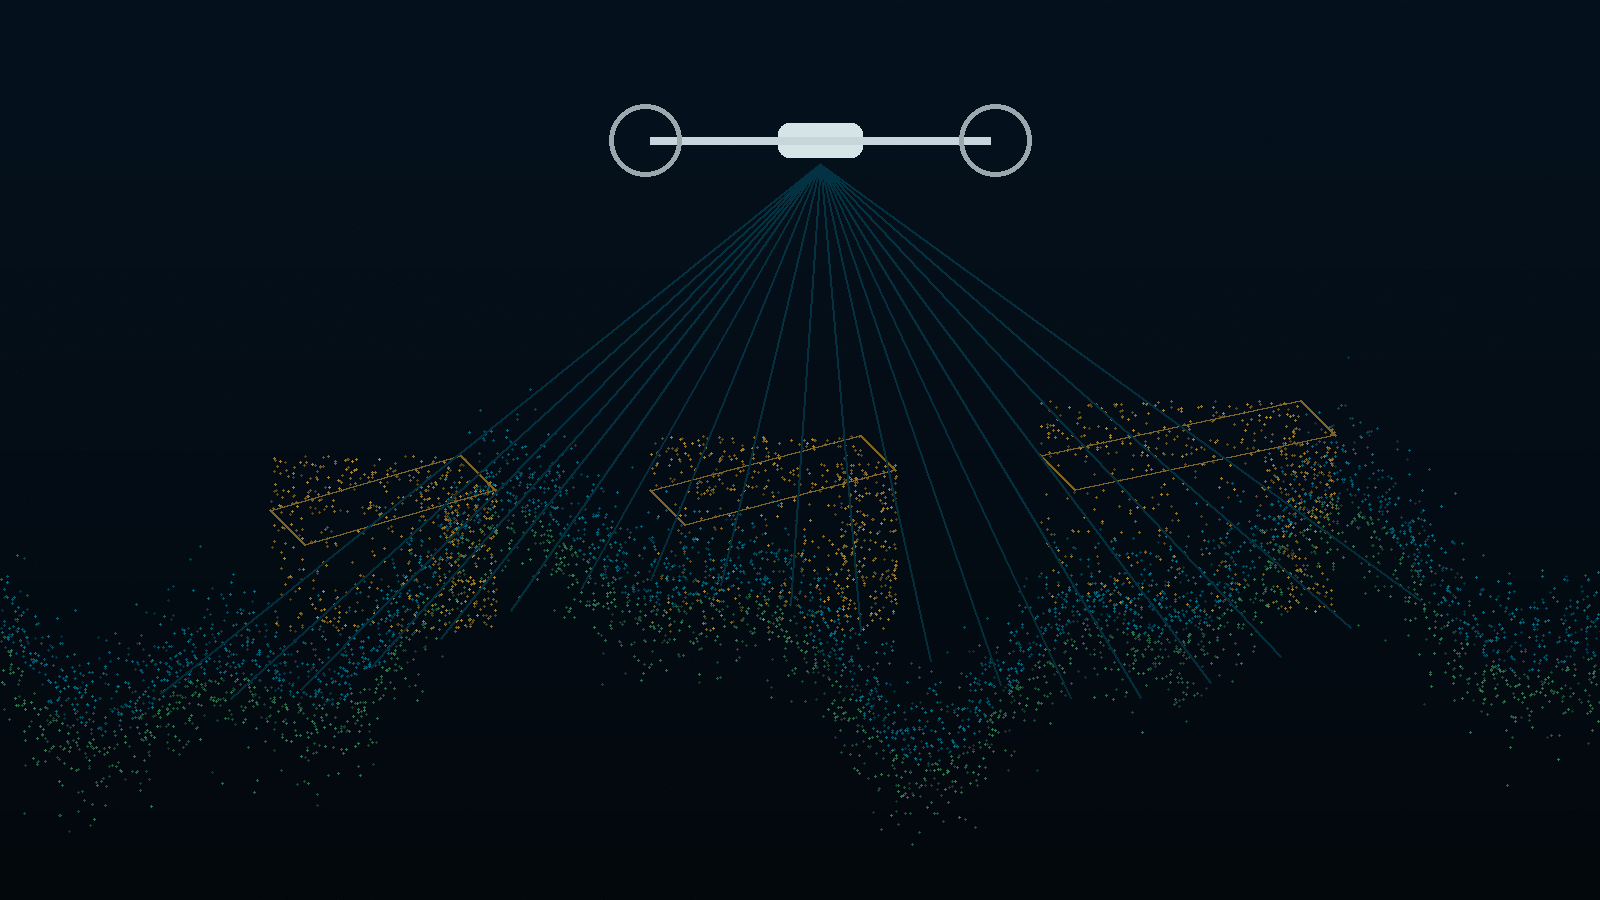
- Georeferenced point cloud for terrain, buildings, vegetation and infrastructure.
- Digital models: DTM, DSM, contour lines, longitudinal and cross sections.
- Volumetrics for stockpiles, excavations, storage areas and earthworks.
- Support for CAD, GIS, BIM and tracking change over time.
- Useful in hard-to-reach areas, over large perimeters or at sites with operational risk.
Delivery formats: LAS/LAZ, orthophoto, DSM/DTM, DWG/DXF, shapefile or GeoPackage, plus a technical PDF report.
How an inspection runs
- Technical brief — objective, risks, access conditions, expected deliverables.
- Flight plan — paths, sensors, safety measures, weather window.
- Data acquisition — RGB, thermal, LiDAR, RTK/GCP.
- Processing — orthophoto, point cloud, georeferencing.
- Analysis — anomalies, severity, probable causes.
- Final report — PDF, CAD/GIS, recommendations and priorities.
Optionally, surveys are repeated along the same paths, for annual comparison, progress audit and predictive maintenance.
What you receive
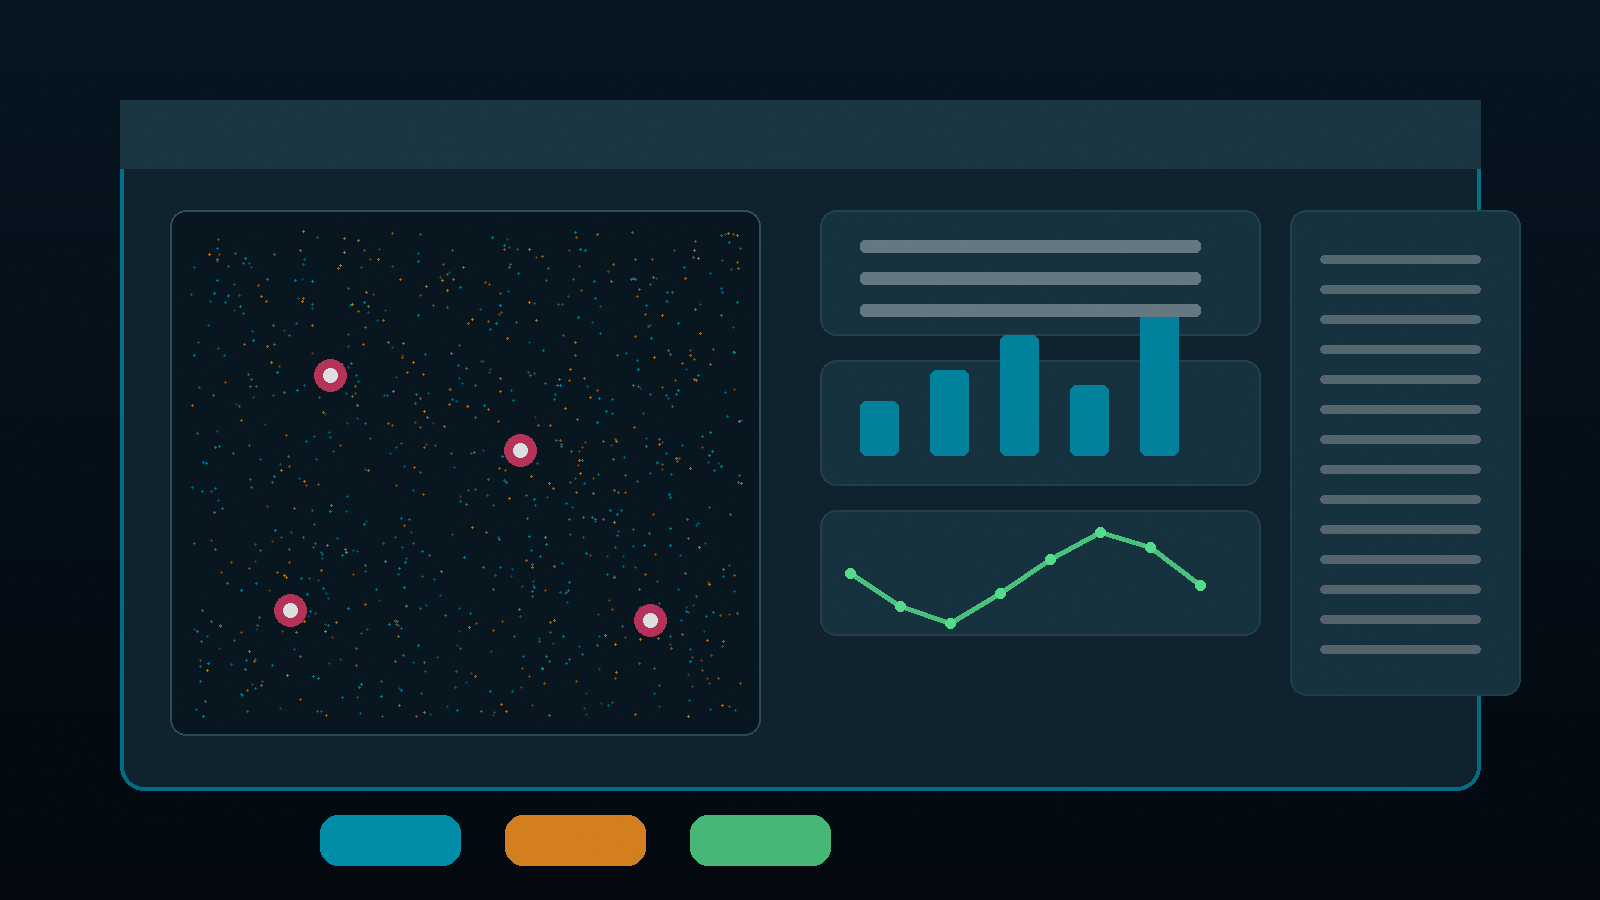
- Technical PDF report — findings, images, severity, recommendations.
- RGB and IR maps — orthophoto, thermogram, anomaly positions.
- Point cloud — LAS/LAZ, terrain model, buildings, vegetation.
- CAD/GIS files — DWG, DXF, SHP, GeoPackage, with coordinates.
- Anomaly table — identifier, location, defect type, priority, notes.
- Photo and video — visual documentation for the technical file.
All deliverables are archived for later comparison: “now” against “after the works” against “the next survey”.
Packages
- Basic — a quick survey of one site or a limited area, photo and video with the main observations, a short report with general recommendations. For initial checks, quick handovers or preliminary assessments.
- Plus — RGB and thermal survey, anomaly map, severity table, technical PDF report and an organised gallery. For panels, buildings, installations, maintenance and internal audit.
- Expert — LiDAR and point cloud, CAD/GIS files and 3D models, extended report and technical consultancy. For infrastructure, volumetrics, design work and recurring comparisons.
- Across all three — a quarterly, half-yearly or annual monitoring subscription, with comparisons and anomaly history.
Flights are carried out in accordance with the civil aviation rules in force and, where required, with prior authorisation of the flight area.