The optimal thermal environment improves the performance of office work
10.08.2020
Introduction
The wages of office workers are often higher than the costs of operating a building in developed countries. Consequently, even reduced improvements in human performance and productivity as a result of improved environmental quality (IEQ) indicators can lead to a substantial economic benefit. It is estimated that improving the indoor environment in office buildings would lead to a direct increase in productivity from 0.5% to 5% per year. This estimate includes the effects of the thermal environment and the quality of lighting that affects vision, and is partially affected by indoor air pollution or odor distractions and their effects on productivity.
Although the potential productivity benefits are quite substantial, they are generally not taken into account in the cost-benefit economic calculations related to the design and operation of the building. This is despite the fact that construction engineers are gradually interested in improving indoor environments and quantifying the subsequent effects of these improvements on productivity. In addition to the relationships between air quality, ventilation and performance, ventilation rate and absence rate, the function of estimating the effect of temperature on the performance of office work was also developed.
The aim is to compare the quantitative relationships between the thermal environment (temperature and thermal sensation) and human performance. The effects of indoor temperature on human performance are then discussed taking into account seasonal differences (winter versus summer), as well as the selection of different categories of indoor environments used for design, as prescribed by European standard EN15251 (2007).
The relationship between the thermal environment and work performance
Air temperature is the indicator frequently used in the thermal environment in IEQ (indoor environment quality) and in productivity research. One of the first attempts to create the relationship between temperature and performance was made by Wyon (1986) and was based mainly on his experimental studies; differentiated relationship between summer and winter effects (depending on clothing), as well as between effects for different types of work. The relationship showed that both high and low temperatures have negative effects on the performance of office work.
It should be discussed whether the effects of thermal environment on performance should only be defined using temperature or other values such as thermal discomfort should be used. This question is particularly valid given that Wyon (1975) showed that subjects can achieve similar performance results under two different temperatures of about 23.2 ° C and 18.7 ° C. At both temperatures they obtained the subjective evaluation of thermal neutrality by easily adjusting the air temperature. This question is also valid given that the thermal discomfort is not only influenced by temperature, but is the result of the combination of six parameters:
- metabolic heat production (physical activity)
- clothing
- temperature
- average radiant temperature
- air speed
- air humidity
Different combinations of these parameters can result in the same thermal sensation or Predictive Mean Vote (PMV) as defined by Fanger (1970).
Consequently, these two indices together with temperature can be used to describe how the thermal environment affects performance.
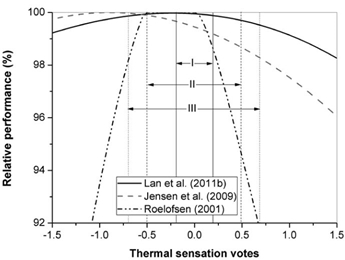
Figure 1 Relationships between thermal sensation and relative performance with overlapping categories of indoor environment according to standard EN15251 (2007); TSV is coded as follows: -3 = cold, -2 = cold, -1 = slightly cold, 0 = neutral, 1 = slightly warm, 2 = warm, 3 = warm.
Figure 1 compares the three different relationships between thermal sensation and work performance developed by Roelofsen (2001), Jensen (2009) and Lan (2011b). It shows that there is a thermal sensation for optimal performance: feeling too cold or too hot will negatively affect performance, although the effects are not symmetrical around thermal neutrality and are somewhat inclined towards the slightly cold sensation. The Roelofsen (2001) model indicates the greatest impact of thermal discomfort on performance and has the highest level of uncertainty. Jensen's (2009) relationship is similar to Lan's (2011b) relationship on the cold side, although it is much different on the warm side of the thermal sensation scale. The lowest impact on performance is observed in the Lan relation (2011b) which included only laboratory data.
Using the relationships shown in Figure 1, the Roelofsen (2001) relationship predicts that changing category III to category I can increase performance by at least 6.98%. For thermal conditions outside the criteria defined in categories I to III (category IV), it can be expected that the performance can be reduced by at least 0.5% compared to the optimal one and probably even more. All reports show that designing for a smaller environmental category will result in reduced performance.
Season-specific analysis
The relationship between thermal sensation and performance developed by Lan (2011b) was used to create the relationship between temperature and performance for summer (Figure 2) and winter (Figure 3) to examine the effect of the season on the predicted effects of temperature on performance. Lan's relation (2011b) was used for this purpose, as it shows the most conservative estimates of the effects of the thermal environment on the performance between the relationships shown in Figure 1, although other relationships can be used. Thus the effects presented below are the minimal effects. When Figures 2 and 3 are created, the median radiant temperature is assumed to be equal to the air temperature (ie the operating temperature is equal to the air temperature), the activity level should be 1.2, the air speed should be 0.15 m / s and the relative humidity will be 50%.
The relationships between temperature and performance, which are independent of seasonal changes and which were developed by Berglund (1990) and Seppänen (2006), were superimposed on Figures 2 and 3 for comparison.
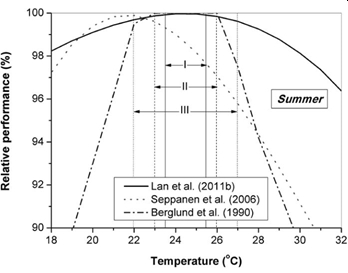
Figure 2 Relationships between air temperature and performance with overlapping indoor environment categories for summer conditions according to standard EN15251 (2007).
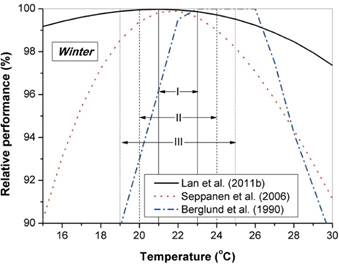
Figure 3 Relationships between air temperature and performance with overlapping indoor environment categories for winter conditions according to standard EN15251 (2007).
Using the relationships shown in Figures 2 and 3, it is estimated that performance will decrease from optimal performance of 100% between 0.08% and 0.39% in summer and between 0.14% and 0.49% in winter. Therefore, the change of the indoor environment category from III to I, can be expected to improve the performance of office work by at least 0.31% to 0.35%. For temperatures outside category I to III (category IV), performance can be expected to be reduced by at least 0.39%. This also shows the temperature requirements for different categories of indoor environment, as specified by standard EN15251 (2007).
Figures 4 and 5 show the impact of changes in clothing insulation during summer and winter on air temperature for optimal performance; they are based on the relationship between Lan et al. (2011b) shown in Figure 3. The insulation of each assembly is calculated as described in the ASHRAE (2005) manual. All sets include shoes and shorts or panties. During the summer, the indoor air temperature for optimal performance can be increased from about 23.9 ° C to 25.4 ° C when people wear walking shorts and a short-sleeved shirt. The indoor air temperature for optimal performance can be lowered from about 21.9 ° C to 19.7 ° C in winter, when pants, long-sleeved shirt, long-sleeved sweater and thick-sleeved vest are chosen appropriately.
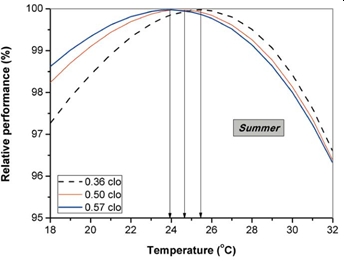
Figure 4 The relationship between indoor temperature and human performance at different levels of clothing insulation in summer conditions.
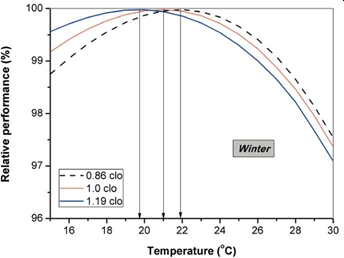
Figure 5 Relationship between indoor temperature and human performance at different levels of clothing insulation for winter conditions.
Implications
Many countries now require that thermostats should be set above in hot weather to save the energy used to cool buildings. Figure 4 shows that raising the air temperature to 28 ° C and above, even with very light clothing, can reduce performance by at least 0.5% if Lan's most conservative relationship (2011b) is selected. Elevated temperatures can also lead to adverse physiological reactions (e.g., eye problems, altered respiratory patterns, and oxygen exchange), which can consequently affect health conditions and performance, although it is currently unclear whether these effects are due only to high temperature or due to thermal discomfort or both. As high summer temperatures can have negative consequences for building users, it may be recommended that summer air temperature be set in the lower half of the summer thermal comfort range, mainly to improve the performance of office work, but also to avoid negative health. It must not cost energy if only methods that avoid thermal discomfort due to low-energy heat are advanced. One of the methods worth considering can be, for example, the use of customized ventilation for cooling, intensifying the convective heat transfer.
Also, many countries now require that thermostats need to be lowered in cold weather to save energy used to heat buildings. Figure 3 shows that maintaining winter temperatures at 20 ° C would have virtually a minimal effect (approximately 0.05% decrease) on performance. It is estimated that eliminating temperatures above 23 ° C in winter would lead to annual economic benefits of which 70% are attributed to improved performance and 30% to the low prevalence of SBS - Sick Building Syndrome symptoms. As shown in Figure 4, the temperature for optimal winter performance could be effectively lowered by increasing the insulation level of the garment. Thus, keeping buildings in the winter at the colder end of the recommended comfort range may not affect performance, but it can substantially reduce many acute symptoms, all of which are achieved by saving a large amount of energy.
Limitations
The relationships shown in Figures 1 to 5 are applicable to buildings with mechanical heating and cooling. Specifically, Figures 2 and 3 provide different cooling / heating settings when applying the Fanger (1970) PMV model. For buildings without mechanical cooling, the indoor temperature (being the temperature at which people want neither more cooling nor more heating) is a function of the outdoor temperature, as prescribed by the adaptive comfort model (by Dear and Brager, 1998; EN15251, 2007). According to the adaptive model, it is possible to achieve thermal neutrality over the entire range of outdoor temperatures, due to adaptive actions such as opening windows, adjusting clothing and changing behavior.
More data on performance effects would be required from buildings where thermal conditions are specified using the adaptive model. However, it should be noted that thermal conditions that provide thermal neutrality, for example defined by the adaptive model, may not give rise to maximum performance. This has already been demonstrated by Pepler and Warner (1968) and is well illustrated by the relationships shown in Figure 1 which indicate that a slightly cold environment promotes performance.
Conclusions
Inadequate thermal conditions, expressed as high temperatures, either too low, too hot or too cold, have significant negative effects on human performance.
Studies indicate that a comfortable cold environment is beneficial for office work. Avoiding high temperatures in winter and summer can bring measurable benefits.
The design of the thermal environment for the lower category of the indoor environment, as specified in the standard EN15251 (2007) will determine the low performance of office work.
The potential savings for first costs and operating costs by designing for the lower category of the indoor environment can therefore be offset by the low performance of office workers. Thus, designing for the highest category would be desirable.


